21. October 2024

Category: Stocks

b26f687a-2d51-4eeb-bd68-d00e13a3429d-Ww9Pz6-scaled.jpeg

October 20, 20245min83
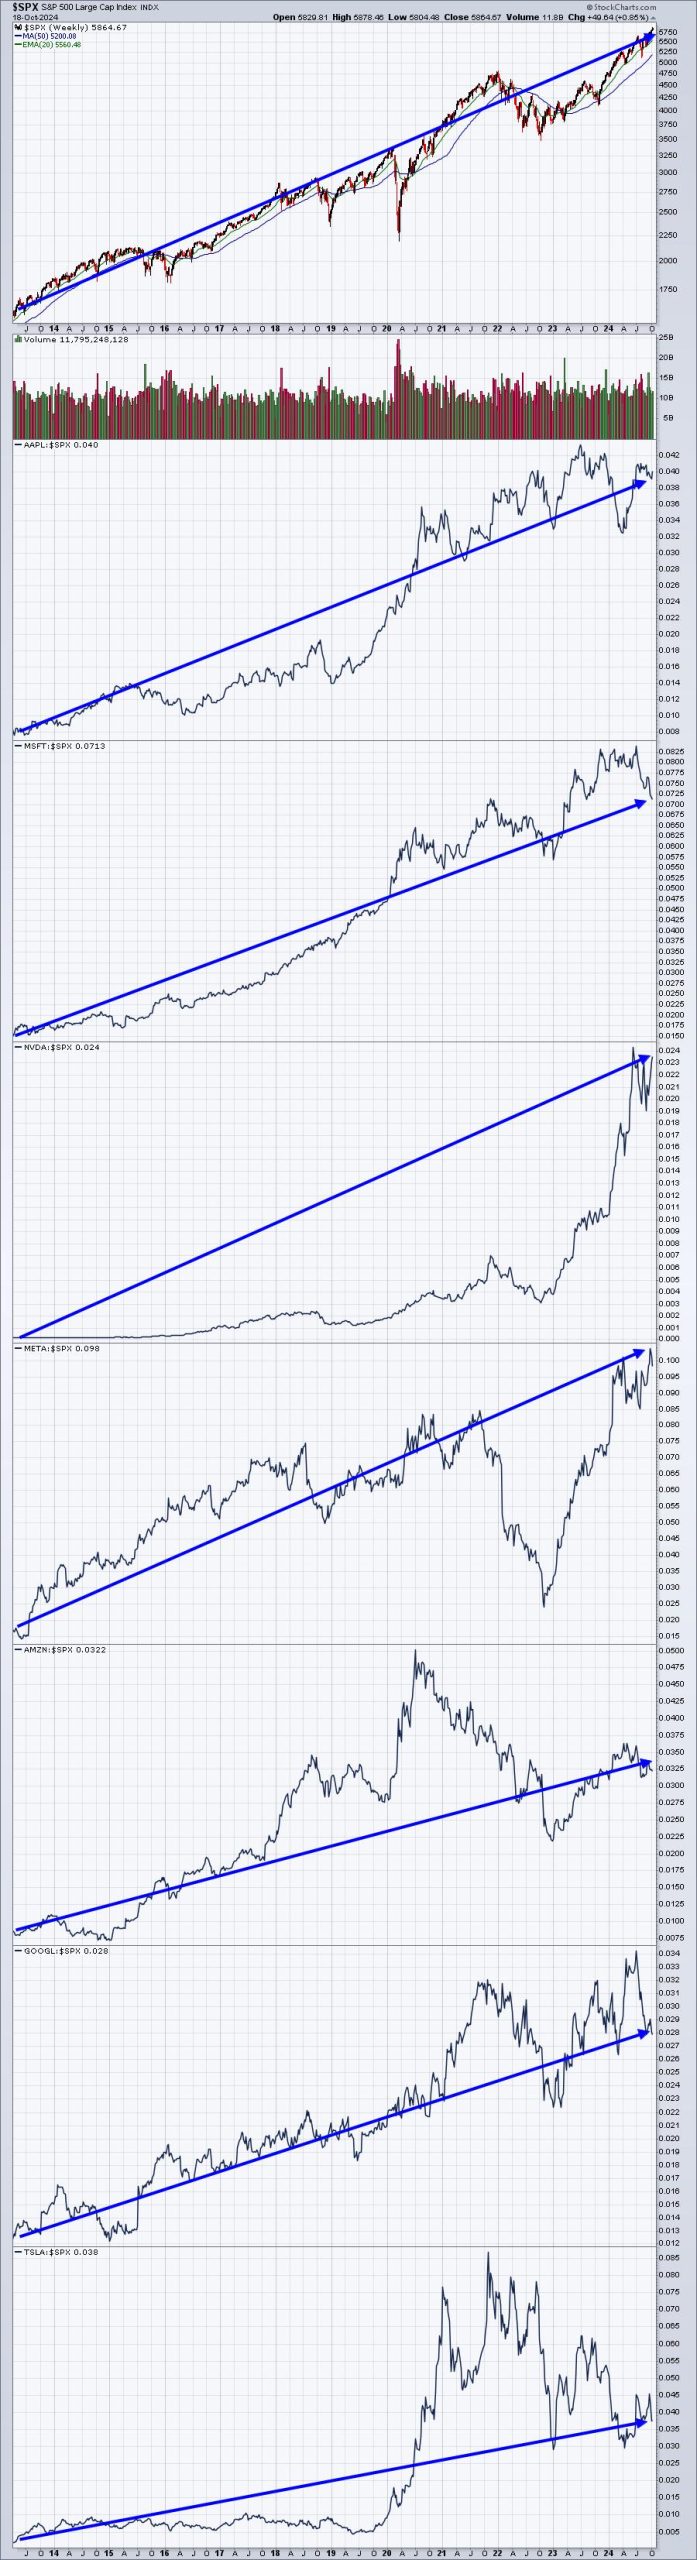
The “Magnificent 7”, comprised of Apple (AAPL), Microsoft (MSFT), NVIDIA (NVDA), Meta Platforms (META), Amazon.com (AMZN), Alphabet (GOOGL), and Tesla (TSLA) have carried the S&P 500 during this secular bull market – since its breakout in April 2013 above its 2000 and 2007 highs. Here’s a weekly chart of the S&P 500 during this secular […]

59ceec0b-1470-41fd-9d04-36cbc4242850-hTfjHj.jpeg

October 19, 20249min81
Despite a light economic data week, the stock market continued its rally, with the S&P 500 ($SPX) and the Dow Jones Industrial Average ($INDU) closing at record highs. How many times have we heard that? This is the sixth positive week for the three indexes. Strong earnings from big banks, Taiwan Semiconductor Mfg. (TSM), United […]

fd9f408a-2fd0-4f86-b052-e2df3614e7ed-yCxokO.jpeg

October 19, 20246min80
In this week’s RRG video, I shared my concerns about the current market conditions. The sector rotation model and current sector rotation, as we see it on the Relative Rotation Graph for US sectors, are sending us conflicting signals. This combination continues to make me cautious about fully buying into the rally with new positions. […]

8ff8eafe-2f0b-4ebd-a4a8-b6755d7773bf-rgYL0b.jpeg

October 19, 20242min80
In this StockCharts TV video, Mary Ellen reviews what’s driving the markets higher and how you can capitalize. Moves in TSLA, NVDA, and NFLX are highlighted. She also reviews price action greatly impacted by earnings, many driven by analyst upgrades and downgrades. This video originally premiered October 18, 2024. You can watch it on our dedicated page for […]

ab9a7124-bb28-42e3-8724-a1c258b22f17-ovZDy2-1280x640.jpeg

October 19, 20247min79
The Moving Average Convergence/Divergence (MACD) indicator, created by technical analyst Gerald Appel, is a technical indicator designed to confirm once a trend change has occurred. Based on exponential moving averages, it is not built to anticipate a price reversal, but rather to identify that one has already occurred. The lesser-known MACD histogram can actually provide a […]

a2b133ed-89ca-4a0f-9827-2750bc2683b6-eCIFVc.jpeg

October 17, 20248min91
At DecisionPoint, we track intermediate-term and long-term BUY/SELL signals on twenty-six market, sector, and industry group indexes. The long-term BUY signals are based upon the famous Golden Cross, which is when the 50-day moving average crosses up through the 200-day moving average. (We use exponential moving averages — EMAs.) Intermediate-term BUY signals are based upon […]

2186aa57-c4d9-4806-a79d-8fa1b5585dec-POUOV9-1280x720.jpeg

October 17, 20247min87
When the market is rallying in full swing, it can sometimes be difficult to select which stocks, among the hundreds, might present the best case to buy. For spotting the strongest stocks on a technical basis, the StockCharts Technical Rank (SCTR) can be an essential tool. There are many ways to use the SCTR Report. […]

3d2fd9a0-f62c-4364-a024-0f6468804c21-6zlOIK-1280x640.jpeg

October 17, 20246min180
At some point, this raging and relentless bull market has to slow down — right?!? And yet, as you’ll see from a quick review of three key market sentiment indicators, there could still be plenty of room for further upside in risk assets. Today we’ll break down three of the market sentiment indicators I’m following to […]